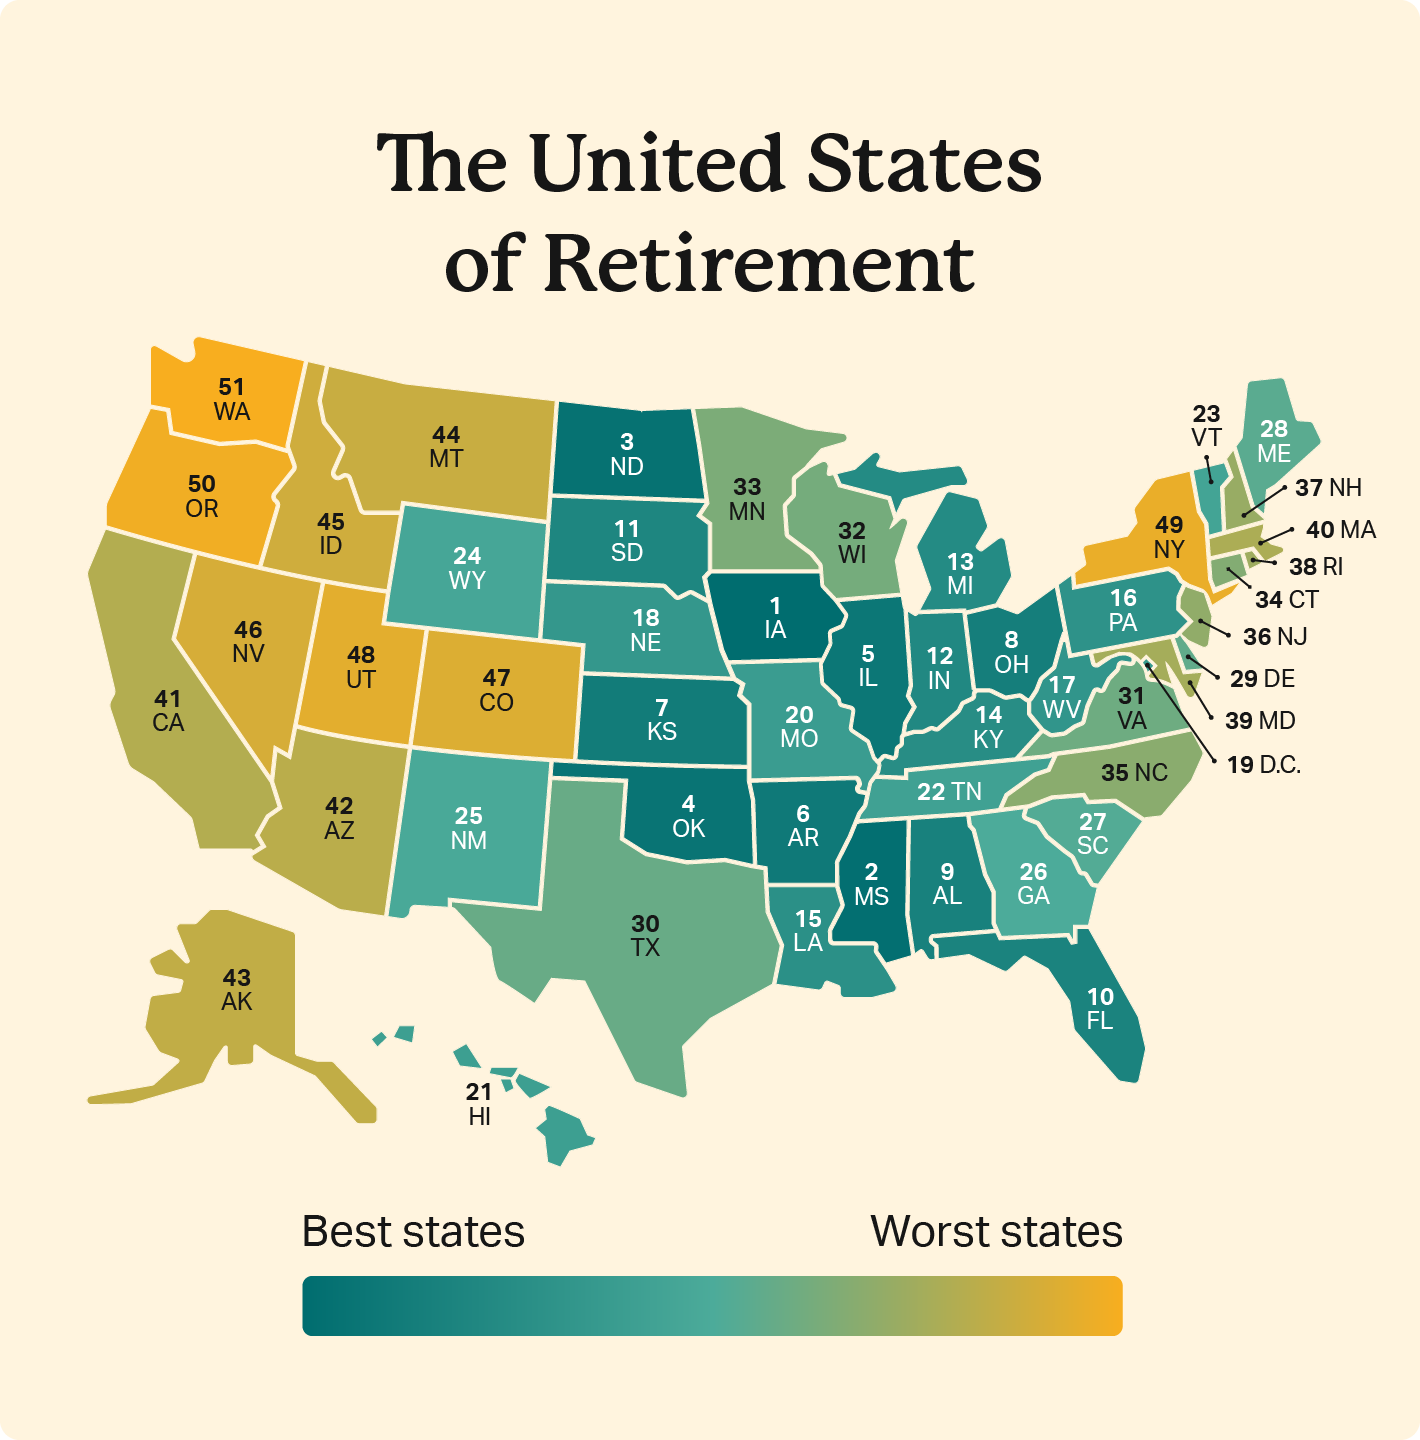
I am retired, so should I be thinking about what state I should be living in? One of the best part of the United States is the differences of each state. Taxes, Healthcare, Cost of Living, Climate, Crime, Housing, and Quality of Life are all factors to consider.
I aggregated the data from Moneywise, Motley Fool, Seniorly, Bankrate, Retirement Living, and Wallet Hub to get a better look at where I should consider moving.
| Rank | State | AVG | MIN | MAX |
| 1 | Florida | 11.0 | 1 | 41 |
| 2 | Pennsylvania | 11.8 | 5 | 20 |
| 3 | Wyoming | 13.2 | 1 | 45 |
| 4 | South Dakota | 14.3 | 5 | 39 |
| 5 | Minnesota | 15.3 | 2 | 27 |
| 6 | Maine | 16.2 | 2 | 34 |
| 7 | New Hampshire | 16.5 | 1 | 43 |
| 8 | Wisconsin | 16.8 | 5 | 36 |
| 9 | Delaware | 17.7 | 5 | 35 |
| 10 | Iowa | 18.0 | 8 | 27 |
| 11 | North Dakota | 18.2 | 8 | 40 |
| 12 | Idaho | 18.3 | 5 | 31 |
| 13 | Utah | 19.5 | 7 | 39 |
| 14 | Virginia | 21.0 | 10 | 41 |
| 15 | Ohio | 21.2 | 15 | 29 |
| 16 | Michigan | 21.7 | 13 | 32 |
| 17 | Missouri | 21.7 | 11 | 32 |
| 18 | West Virginia | 21.7 | 2 | 43 |
| 19 | Montana | 22.7 | 2 | 47 |
| 20 | Rhode Island | 22.7 | 6 | 44 |
| 21 | Vermont | 22.7 | 4 | 48 |
| 22 | Nebraska | 22.8 | 2 | 46 |
| 23 | Colorado | 23.2 | 3 | 37 |
| 24 | North Carolina | 23.3 | 4 | 40 |
| 25 | Indiana | 23.7 | 15 | 40 |
| 26 | District of Columbia | 25.5 | 1 | 50 |
| 27 | Georgia | 25.7 | 9 | 48 |
| 28 | South Carolina | 26.2 | 1 | 44 |
| 29 | Connecticut | 26.7 | 13 | 44 |
| 30 | Oregon | 27.5 | 14 | 39 |
| 31 | Maryland | 28.7 | 3 | 45 |
| 32 | Tennessee | 28.7 | 8 | 43 |
| 33 | Alaska | 29.0 | 4 | 51 |
| 34 | Nevada | 30.3 | 14 | 46 |
| 35 | Texas | 30.3 | 6 | 49 |
| 36 | Arizona | 31.0 | 18 | 42 |
| 37 | Mississippi | 31.0 | 5 | 48 |
| 38 | Alabama | 31.5 | 3 | 50 |
| 39 | Kansas | 31.5 | 12 | 49 |
| 40 | Illinois | 31.8 | 24 | 38 |
| 41 | Kentucky | 32.5 | 10 | 50 |
| 42 | Massachusetts | 33.3 | 16 | 48 |
| 43 | Arkansas | 33.5 | 17 | 47 |
| 44 | New Jersey | 35.0 | 9 | 51 |
| 45 | Oklahoma | 35.5 | 7 | 48 |
| 46 | Louisiana | 35.8 | 23 | 50 |
| 47 | Hawaii | 36.3 | 25 | 50 |
| 48 | New Mexico | 36.3 | 17 | 50 |
| 49 | Washington | 38.0 | 29 | 47 |
| 50 | California | 39.8 | 21 | 49 |
| 51 | New York | 42.0 | 30 | 49 |
What Did I learn? Very little.
The average Standard Deviation was 14.6. An insane number. Usually when I aggregate rankings, there is a good amount of agreement, especially near the top.
Florida was the winner, but it had an average ranking of 11. The District of Columbia was only ranked on two sites, one had them at 1 and the other at 50.
I was also frustrated to see that a state I have considered retiring to, Washington, was the third-worst state and didn’t finish in the top half of any list.
I now know that I need to create my own scoring metric for my unique situation.